
There’s now support for (graphically) debugging python applications from within KDevelop, like it works with C++.
The implementation relies on communicating with the default python debugger, pdb, which is shipped with python. It aims to nicely map all of pdb’s features to buttons and tooltips / toolviews.
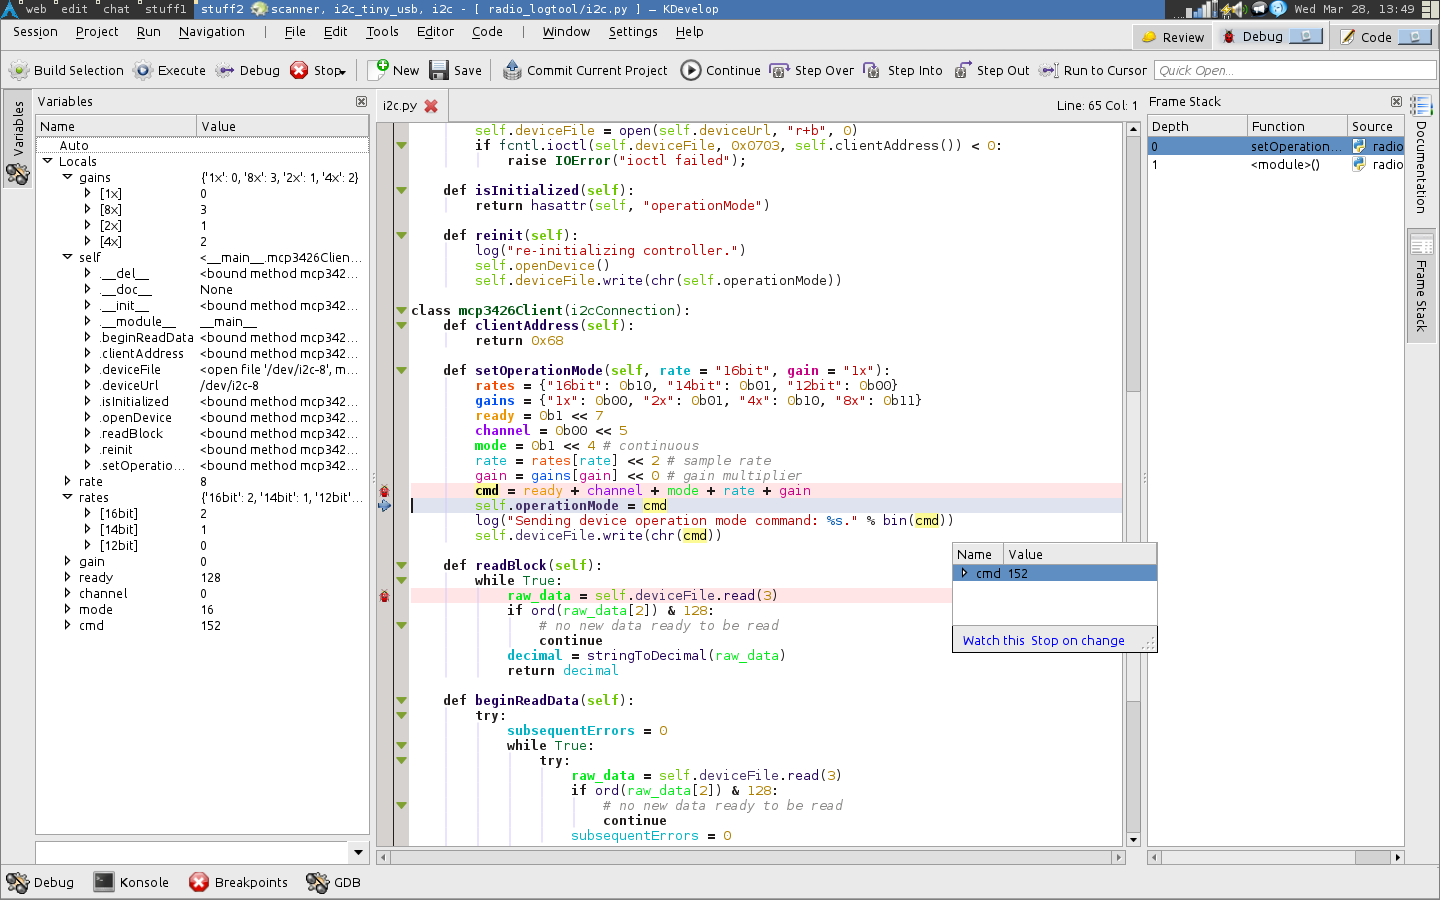 |
| kdev-python debugger in action |
Features
Key features include:
- Step through code using the well-known “next”, “continue”, etc. buttons; KDevelop will automatically open up the source file you’re currently stepping through
- Inspect the frame stack and switch between frames (toolview on the right in the above screenshot — just click a frame to switch there)
- Set and remove breakpoints by clicking the left editor border, even while the application is running (requires extra work in plain pdb)
- A list with all local variables which is automatically updated (left toolview)
- Possibility to add custom expressions, which are automatically re-evaluated, like seen in the screenshot below
- Query the value of any expression in your code while the debugger is paused by moving the mouse over it (the value will be shown in a tooltip)
- Inspect frame stack and variables after your application crashed (i.e. threw an uncaught exception)
 |
| Automatically evaluate custom expressions (top left) |
How to use it
As always, this feature is available in the master branch of kdev-python (http://projects.kde.org/kdev-python). To use the debugger, configure a script launch for your application (Run – Configure launches, Add new, then select “Script Application” in the tree view on the left under “type”), then click the “Debug” button in the toolbar.
 |
|
| Example launch configuration for using the debugger |
Improving that launch config dialog is next on my to-do list 🙂
Remaining issues
There’s a few things left which are currently missing or broken:
- Debugging is only supported for python 2.x applications. I will not support python 3.x before I switch to it completely (probably this summer).
- The display of the children of a variable is not optimal, it would greatly profit from heuristics about which items are important and which ones aren’t (you usually don’t want to inspect the __get__ method, do you).
- There’s probably a few bugs left — please report anything you find to bugs.kde.org.
- “Run to cursor” is not well written, i.e. will stop at breakpoints
- Breakpoint conditions are not supported, neither is disabling breakpoints (you can just remove them).
 |
|
| Inspecing the frame stack of a crashed application |
Those issues will be fixed in future releases.
Categories: Everything
Tags: debugger, kdevelop, planetkde, python
woot! this looks awesome! I've waiting for a this feature for a while! thanks for the good work!
Cool stuff!
(/me should polish and relase kdev-xdebug)
Nice to see the progress. I am looking forward to have a lightweight alternative to Eclipse+PyDev.
P.S. Why in the first screenshot 0b00 is not colored fully as a number?
I'd also like to know that. In kate, it works, but in KDevelop it doesn't, even if the background parser is disabled. Weird.
Ironically, this "lightweight alternative" already has far superior semantic support for Python than PyDev.
Semantic support is just a part of what should happen for me to replace PyDev…
What else would be needed for your usecase?
This is super awesome !
Are there any deb packages for Ubuntu with the recent version of kdev with python support?
or where can i find a comprehensive guide to install kdev with python support?
Here's a very verbose guide on how to install kdevelop:
http://techbase.kde.org/Projects/KDevelop4/HowToCompile
Note that you need to install the git versions if you want to use kdev-python.
You can install the python plugin in the very same way as kdevelop and kdevplatform then, just replace every occurence of "kdevelop" by "kdev-python". Notice that there's one additional step required for kdev-python the first time you compile it; see the INSTALL file for details. If you encounter problems, just ask in the kdevelop IRC channel (#kdevelop on irc.freenode.net).
As far as I know there's no up-to-date git packages for kdevelop on ubuntu. I might be wrong, tough.
Hi I am using kdev-python with KDevelop 4.4.1 in Arch Linux. Is there a manual, tutorial or anything on how to configure things for running from within KDevelop and debugging a single script file like hello world. I am in engineering and I generally just need to write single script file for what I do, IDLE works great for writing. But now I want to move to Kdevelop because of the debugging (where I can see the variables as I step through my program) it can provide.
Go to Run -> Configure launches. Add a new launch using the button. In the treeview on the left, select "Script Application" (instead of "Native Application" — you might need to scroll a bit), then as an interpreter, enter "python2", and for script enter the full path to your script. Then, click Debug.
We're aware that this dialog is not very convenient, and it has already been improved. Those improvements will be in 4.5. 🙂
Great!!! Thanks a lot.