With a reasonably simple setup, I finally succeeded in detecting the 1420.4 MHz galactic hydrogen hyperfine structure line:
Setup
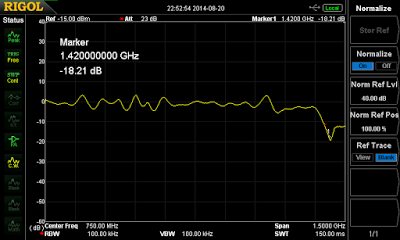
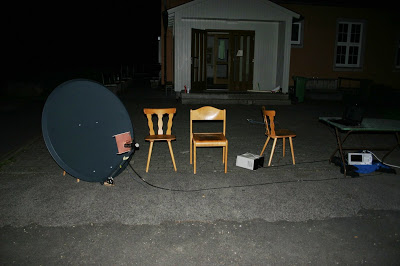
The setup consists of a 1.2m dish with a feed and two homemade 1.4 GHz low-noise preamplifiers. The amplifiers have about 19dB of gain each at 1.42 GHz and a noise figure too small to measure for my equipment (certainly below 2dB I would claim). The simulated noise figure is about 0.4dB, but that is without taking the Q factor of the matching components into account. A spectrum analyzer (Rigol DSA 815) is used as the detector for now.
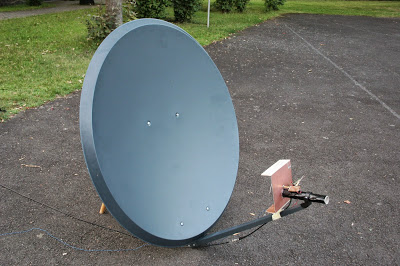 |
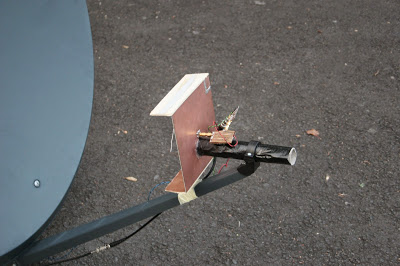
| Dish with mounted feed (for the latter, see text and pictures below) |
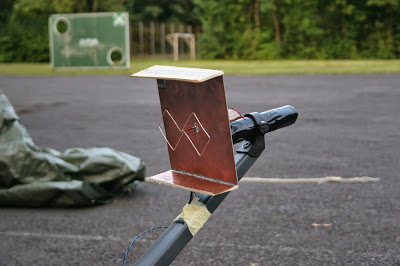
Since you obviously cannot simply attach a coaxial cable to a parabolic dish reflector, a so-called feed is required to absorb the radiation collected by the dish reflector. I adapted a feed design commonly used for wireless LAN for the HI frequency (which is done by just multiplying all lengths by the ratio of the two frequencies). This design consists of a biquad antenna over a ground plane with two reflectors on the side (those are to make the radiation pattern more symmetric and fit the dish better). It provides an excellent match at the design frequency and seems to work well.
For the more serious measurements I conducted, the detector (digital spectrum analyzer, gray box below — the thing which makes the black screenshots with the yellow curves in them) is controlled by a computer. It records 4 sweeps with 30 seconds duration each and about 1 MHz bandwidth and averages them; the computer fetches the result and stores it on disk. The camping mat is metallic and serves as interference protection (yes, it actually works … a bit).
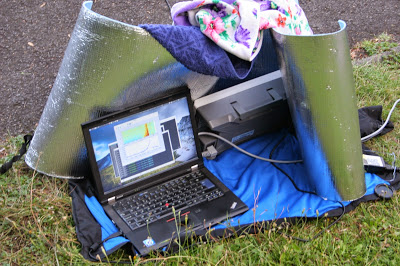 |
| Metallic camping mats designed to isolate the user from low temperatures can also be used as faraday cages — with moderate success. |
Results
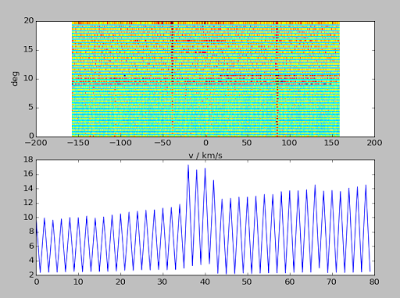
With this recording technique, I was able to take some nice data sets. In all of them, the antenna points into a fixed direction of the sky and the sky moves across the picture. The x (right) axis is frequency; the y axis is time in the upper graph, and intensity in the lower one. Intensity is encoded as color in the upper graphs. Thus, if you look in the upper graph from top to bottom, you actually see different regions of the sky moving across the antenna. In the lower graph, you see the intensity of radiation of all those regions added together (the lower graph is the upper one integrated along the top-to-bottom axis, so to speak). All intensity scales are logarithmic.
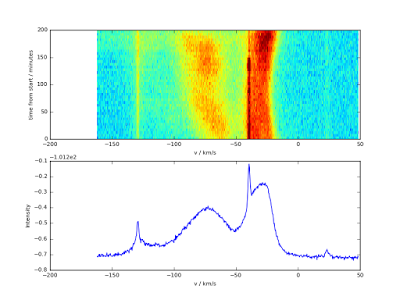 |
| Started quite late in the night, with about 80° elevation (almost straight up); different parts (roughly Cyg, Cas, Perseus) of the milky way move through the picture. |
Unfortunuately, my aiming is quite inaccurate and the antenna beam size is 10 degrees, so I can only very roughly tell what is currently visible in the picture. Still, in the picture above, you can clearly see three wide peaks which are HI emission, and three narrow peaks which are interference. We can remove the interference to get a nicer picture:
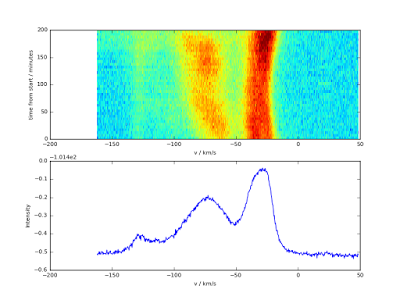 |
| Same picture as above after interference removal algorithm. |
This works by manually flagging the locations of the interference peaks, and then fitting a curve of the form a*x^2+b*x+c+d*exp(-f*(x-e)^2) to those locations (second-order polynomial for the “real”, wide spectrum and a gaussian-shaped peak for the interference).
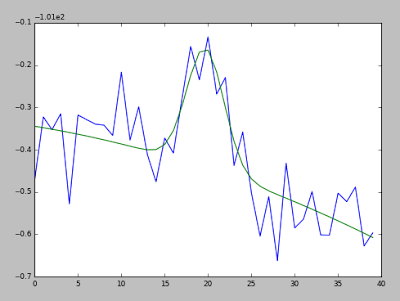 |
| Small section of the spectrum shown above with interference peak (center). The blue line is data, the green line is a fit of a*x^2+b*x+c+d*exp(-f*(x-e)^2) to the data. |
The d*exp(-f*(x-e)^2) term is then simply subtracted from the data, which leaves only the baseline, without the interference peak. This method even partially “recovers” data hidden by the interference peak (how reliable that information is is a different question, but in this case it looks fine).
After this treatment, you can clearly see three wide bulges in the curve.
You might have noticed that the x axis is not labeled with frequency, but velocity. This is because the actual emission of the kind of radiation observed here only happens at one specific frequency (1.4204 GHz — where the 0 in the graph is). Still, we see it at different frequencies because of doppler shift. Thus, the observed frequency of the radiation translates directly to the velocity with which the matter which emits the radiation moves towards us — or away from us.
I would carefully claim that the three observed peaks originate from three different spiral arms of the milky way which rotate with different velocities. I’m not sure if that is accurate though.
With the same method, I took several more similar pictures of different regions of the milky way, some shown below.
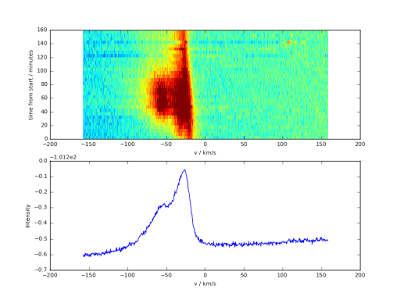 |
| Transit of (roughly) Perseus through the beam. |
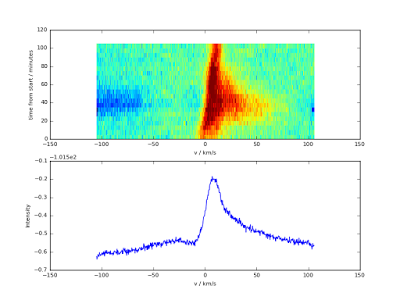 |
| Transit of (again, roughly) Sagittarius / Aquila through the beam. Note that — different from the pictures above — all the matter observed here moves towards (positive velocity) us, not away from us. |
Future plans
My long-term plan is to attempt creating a survey of a significant part of the sky — basically a map which tells how much HI radiation at what doppler shift is observed at which point of the sky. For that, I need two things: A reliable way to determine the antenna position; and a consistent way to compare signal amplitudes.
For the former, I’m currently trying to build a tilt-compensated compass with elevation sensor (basically a three-axis magnetic field sensor and a three-axis acceleration sensor with software). It’s working a bit, but not really.
For the latter, in professional radio astronomy, one tool which is used is a noise diode. That is a small device which injects noise into the receiver system at the very start of the signal path (in my case, it’s a small device inside the biquad feed). It is periodically switched on and off and adds a constant offset to the amplitude of the observed signal. The trick is that this constant offset is reliably constant, over long periods of time. When we see it change in the recorded data (and we will), we can be fairly sure this change is caused by the receiver system (amplifier, detector) changing — for example because of temperature drift. Thus, by dividing the observed amplitude of this constant offset, signals amplitudes can be evaluted even if the receiver and detector system drifts.
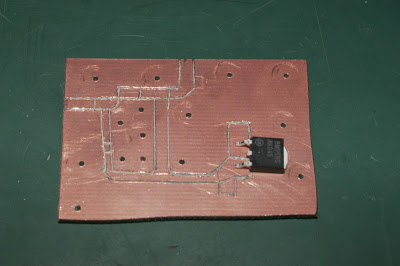
I built a zener-diode based noise generator which seems to work fine for my purpose. It can be switched on and off using a transistor and the Raspberry Pi GPIOs, and is powered by battery to get as little fluctuation as possible in the noise signal itself. The generator is attached to a small piece of wire as an antenna and is glued inside the feed.
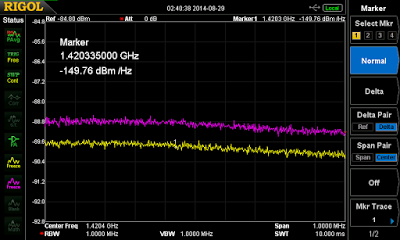 |
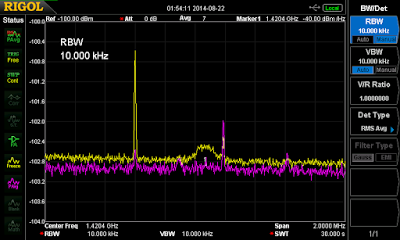
| Noise diode test. Pink curve: noise diode powered on; yellow curve: noise diode off. This is without the feed and amplifiers, but it looks similar with them. |
Caveats of using a spectrum analyzer as a detector for radio astronomy
It took me a while to figure out how to best configure the spectrum analyzer for this purpose. One thing which is easy to overlook (because it is nearly irrelevant in most applications) is that a spectrum analyzer does sweeping measurements, i.e. it measures intensity at one frequency span at a time, then goes to the next etc. This means the resolution bandwith (RBW), which basically controls the spectral resolution of the analyzer, also controls how much signal power is detected at once during the sweep. If it is set to 100 Hz, the analyzer will walk through the whole frequency span in 100 Hz chunks, detecting only 100 Hz of the spectrum’s power at once. If set to 10 kHz, it will detect a hundred times as much power at once — which gives an effective signal-to-noise ratio which is a hundred times better in the end! This is very unintuitive because the noise level displayed by the analyzer actually increases for higher RBW values (which makes sense of course if you think about it: if you accumulate a larger part of the spectrum into a single channel, that channel will have more noise power overall). Thus, when using a spectrum analyzer for this purpose, you have a trade-off between S/N and spectral resolution (you always have a trade-off between S/N and spectral resolution, but in this case it’s far more grave than usual — exponent 3/2 instead of 1/2 [as usual] for the channel count if I’m not mistaken). I selected 10 kHz spectral resolution, more resolution (lower RBW) certainly makes no sense for this kind of signal. Probably 30 kHz would be fine as well — but that makes interference detection and removal harder again because the narrow interference peaks are quite smeared out.
This also means a spectrum analyzer is not a very good detector for this kind of telecope — with 10 kHz RBW and 1 MHz bandwidth (about what I used above) 99% of the signal power are lost simply because they are not detected at a given time.
Conclusion
It is very nice to finally see some results come out of this project. I’m looking forward to improving the receiver system (eventually I want to replace the analyzer by an A/D converter + mixer) and the calibration process.
Categories: Everything
Tags: antenna, astronomy, hardware, hydrogen line

Dear Sir,
are there somewhere details of the biquad feed?
Thank you for potential answer, best regards,
JS
Hey Jan,
I built the biquad feed by just taking one of the numerous guides on how to build a wireless LAN biquad feed (just google one, there are lots) and multiplying all lengths by 2.4 GHz / 1.42 GHz. That already gives you the rough metrics, and then you need to trim it a bit to have the most suitable resonance frequency.
Feel free to email me if you’d like to talk more.
Best,
Sven
hello, I am interested to make a biquad like yours for 1420MHz. Can you provide me with the dimensions please ? I use a MMIC preamplifier, a ral-10-kit runing with Aries on a raspberry pi 2.
Thank you and have good time
Jean Marie
F5VLB
As said in the comment above, just take any of the instructions you find for wireless biquads at 2.5 GHz, and divide all dimensions by the ratio between 2.5 GHz and 1.4 GHz. You will need some kind of return loss analyzer (NWA, SA+TG+coupler, …) to tune the antenna anyways.
Greetings,
Sven
Hello, I would like to know if you only used an LNA yourself or if you also used some bandpass filter. I would also like to know what program you used to plot these graphs.
As detailed in the post, there is a bandpass filter before the LNA.
The plots are created with python’s matplotlib.
Greetings!
Hello, where do you get the measures to build the biquad feed?
You can google a set of instructions you like for a WLAN (2.4 GHz) biquad and then just scale it by the ratio of the frequencies.
Greetings!
What software did you use to get the data?
It’s specifically written for the receiver hardware I built for this project, so nothing you could re-use for anything else.
Greetings!
Sven